Something seismic has happened to the way the world shops. The traditional retail journey — search, compare, add to cart, purchase — is being dismantled and rebuilt inside social media feeds, live video streams, and creator-driven content ecosystems. Social commerce, the direct integration of product discovery and transaction within social platforms, has moved beyond its status as an emerging trend and cemented itself as one of the dominant channels in global retail. As of 2026, this is not a story of potential. It is a story of documented, measured, staggering reality.
The numbers are not shy about this. The global social commerce market now stands at $2.11 trillion in 2026, up from $1.63 trillion in 2025, and is expected to reach $7.55 trillion by 2031 at a compound annual growth rate of 29.12%, according to Mordor Intelligence. In the United States alone, social commerce sales have crossed the $100 billion threshold for the first time, reaching $100.99 billion — an 18% year-over-year increase, per eMarketer. For brands, marketers, sellers, and investors, the message is impossible to misread: social commerce is not a side channel. It is rapidly becoming the primary channel.
What makes 2026 particularly pivotal is the convergence of forces that are amplifying this growth simultaneously. TikTok Shop has matured into a genuine retail juggernaut. Instagram has deepened its native shopping infrastructure. Livestream commerce has introduced conversion rates that make traditional ecommerce look stagnant. And an entire generation of consumers — Gen Z and millennials — has grown up not merely consuming social media but transacting within it as naturally as breathing. This article breaks down every dimension of this $2.11 trillion reality, platform by platform, statistic by statistic, with the analytical depth it deserves.
The Market Landscape: Beyond the $1.2 Trillion Milestone
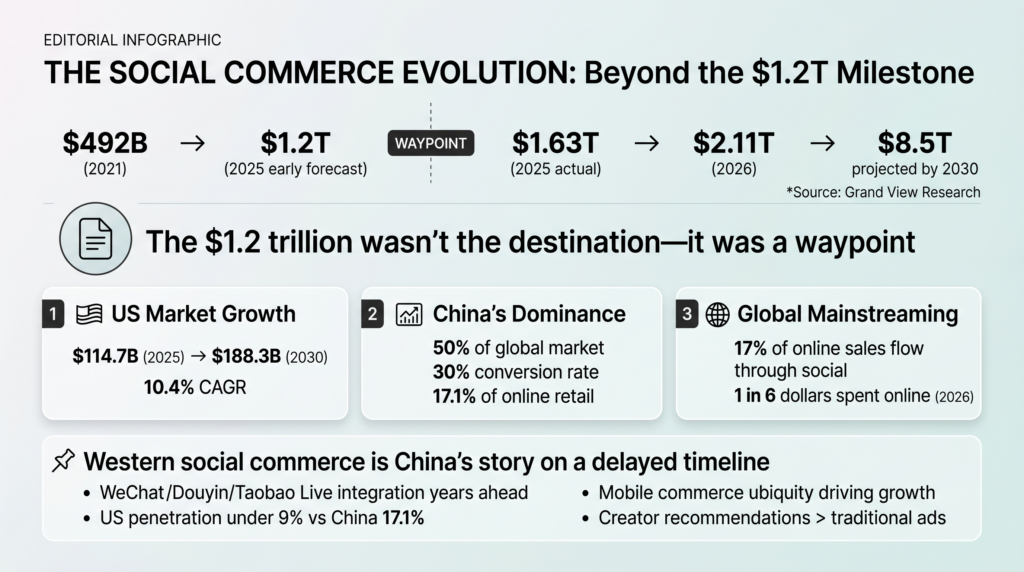
The $1.2 trillion figure that captured headlines in earlier years of social commerce forecasting has long since been surpassed. To understand where we are, it helps to trace the trajectory. In 2021, global social commerce sales stood at $492 billion — formidable but nascent. Accenture, Razorfish, and Forbes had all projected a tripling to $1.2 trillion by 2025, a forecast that proved broadly accurate as a directional signal even as the actual market exceeded those early projections. By 2025, actual global social commerce sales reached approximately $1.63 trillion, and by 2026, that figure climbed to $2.11 trillion. The $1.2 trillion milestone, in other words, was not the destination — it was a waypoint.
Grand View Research projects the global market will expand to $8.5 trillion by 2030, driven by mobile commerce ubiquity, platform investment in native checkout tools, and the deepening trust consumers place in creator-driven recommendations over traditional advertising. The US market specifically stood at $114.7 billion in 2025 and is projected to reach $188.3 billion by 2030 at a 10.4% CAGR.
China’s role in this story cannot be overstated. The country accounts for approximately 50% of the global social commerce market, with Chinese brands achieving a 30% conversion rate on social platforms — far above the global average. Social commerce in China is expected to represent 17.1% of total online retail sales, while comparable penetration in the US remains under 9%. China is not merely ahead on this curve; it is operating in a different era entirely, having spent years integrating commerce with platforms like WeChat, Douyin (TikTok’s Chinese counterpart), and Taobao Live. The Western social commerce story is, in many respects, China’s story playing out on a delayed timeline.
What is most significant about the 2026 market snapshot is the mainstreaming of social commerce beyond China’s borders. By 2026, social commerce accounts for approximately 17% of online sales globally, according to LinkedIn data citing AskSuzy research — meaning that for every six dollars spent online, roughly one dollar flows through a social platform. That figure would have seemed implausible five years ago.
TikTok Shop: The Fastest Retail Ascent in History
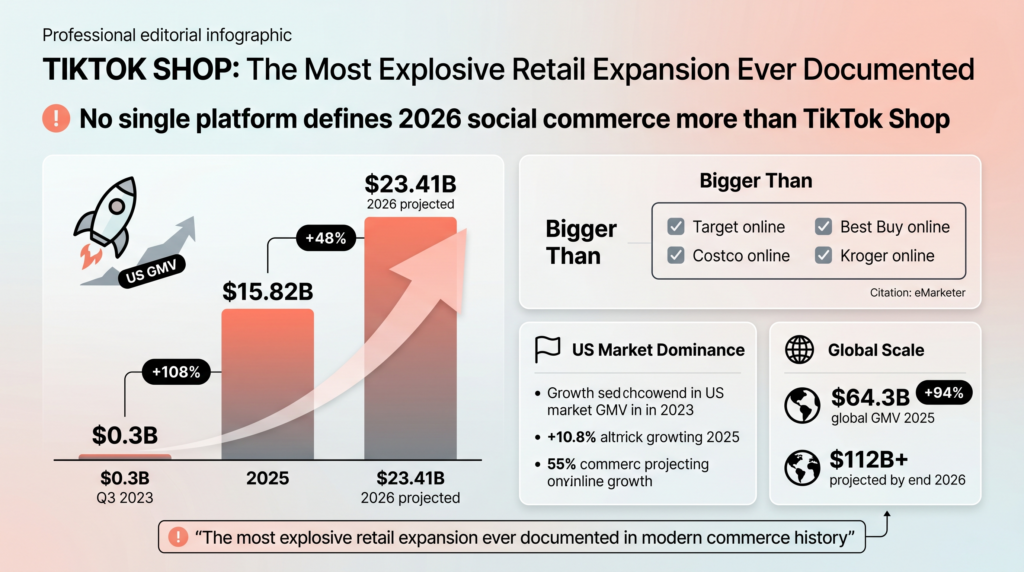
No single platform defines the 2026 social commerce moment more definitively than TikTok Shop. Its growth trajectory is, by any reasonable measure, the most explosive retail expansion ever documented. To grasp the scale, consider this sequence of numbers: TikTok Shop generated $0.3 billion in US GMV in Q3 of 2023. By 2025, that number had reached $15.82 billion for the full year — a year-over-year growth of 108%. In 2026, US ecommerce sales on TikTok Shop are projected to hit $23.41 billion, a 48% increase, making it a larger US ecommerce business than Target, Costco, Best Buy, or Kroger online, per eMarketer. Globally, TikTok Shop’s GMV reached $64.3 billion in 2025 — a 94% year-over-year increase — with projections placing global GMV above $112 billion by end of 2026.
The platform’s market share within social commerce is equally striking. TikTok Shop now commands 18.2% of the total US social commerce market, with expectations to reach 24.1% by 2027. According to Forrester research cited by Amra & Elma, TikTok’s share of US social commerce GMV expanded to 74.3% in 2026 in terms of fastest-growing platform dynamics — an indicator of where consumer energy is flowing.
The user base driving these numbers is vast and skews young. An estimated 80.4 million US users are expected to shop on TikTok in 2026, representing approximately 67% of TikTok’s total US audience. The conversion from viewer to buyer is accelerating, with 49.7% of TikTok shoppers purchasing on the platform at least once per month, and 10.7% purchasing at least once per week. TikTok Shop’s repeat customer rate hit an extraordinary 81.3% in early 2024 — a figure that defies the assumption that social commerce drives only one-off impulse transactions.
The seller ecosystem mirrors this scale. As of 2025, there are 15 million TikTok Shop sellers globally, with over 475,000 registered shops in the US alone — up from a mere 4,450 US shops in mid-2023. Of those registered US shops, 216,000 are actively generating sales, and 1,033 US shops exceeded $1 million in annual GMV, with 77 shops clearing $10 million each. More than 171,000 small businesses are actively selling on the platform.
In terms of category dynamics, health and beauty products dominate, accounting for 79.3% of TikTok Shop sales in the US, with total US beauty sales reaching $1.34 billion, averaging $63.70 per buyer. Apparel and accessories generated $1.01 billion in US sales. In the UK, TikTok Shop became the fourth-largest beauty retailer in 2025, with the category growing 60% year-on-year. K-Beauty searches alone surged 125% on TikTok Shop UK. Jewelry and accessories stood out for a different reason: the category recorded a 36% year-over-year price increase, resisting a broader trend of price declines across other categories — a signal of genuine brand premium being built within the platform. Sales from major brands (those with at least $30 million in annual revenue) increased 97% year-over-year on TikTok Shop in 2025, confirming that established retail is not watching from the sidelines but actively participating.
On the advertising and performance side, TikTok Shop’s average conversion rate for in-app checkout reaches 5% to 8%, compared to the industry-wide average of 2–3% for traditional ecommerce. The overall platform conversion rate averages 3.4%, higher than Instagram’s 1.08% and YouTube’s 1.4%. Affiliate links on TikTok carry a 5.2% engagement rate, which is 160% higher than comparable links on Instagram. The affiliate program itself has become a critical commerce driver, with over 100,000 creators actively using it. Notably, 29.6% of affiliate marketing now happens on TikTok, and 78% of TikTok users report purchasing a product after seeing it in creator content. TikTok influencer marketing spending in the US reached $1.25 billion in 2024 and is estimated at $2.35 billion in 2025. Partnering with a TikTok creator on an ad can boost view-through rates by up to 193%.
The average order value on TikTok Shop US sits at approximately $59 per purchase — modest individually, but multiplied across 80 million shoppers transacting at increasing frequency, it produces a market of historic proportions. During the 2025 Black Friday and Cyber Monday period, TikTok Shop processed over $100 million in US sales in a single holiday stretch.
Instagram: The Visual Commerce Powerhouse Deepening Its Roots
While TikTok Shop commands the attention with its explosive growth narrative, Instagram operates as a quieter but deeply embedded social commerce giant. With an estimated 2.35 to 3 billion monthly active users globally and 46.8 million social shoppers in the US alone, Instagram has built one of the most sophisticated in-app shopping infrastructures available on any platform.
The core shopping numbers are substantial. 130 million Instagram users tap on shoppable posts every single month, demonstrating that product discovery via social content has become a habitual, normalized behavior. Social commerce sales on Instagram totaled $42.8 billion in 2025, generated through a combination of organic discovery, shoppable Reels, stories with product tags, and Instagram’s native checkout infrastructure. The platform’s checkout conversion rate sits at 2.7%, with an average order value of $65 — slightly higher than TikTok Shop’s $59 AOV, reflecting the platform’s stronger foothold in fashion, lifestyle, and premium consumer goods categories.
Consumer engagement with Instagram as a shopping tool is deeply ingrained. 81% of Instagram users research products and brands on the app, and 44% shop on Instagram in an average week. The Instagram influencer marketing industry is valued at $22.2 billion, underlining the scale of the creator-commerce ecosystem operating within the platform. At 46.8 million US shoppers, Instagram is the second-largest social shopping platform in America after Facebook.
Meta has publicly signaled its intention to push shopping harder in 2026, with combined Facebook and Instagram projected revenues approaching $67 billion. This investment in commerce infrastructure — including AI-driven product recommendations, augmented reality try-on features, and expanded live shopping capabilities — ensures that Instagram will remain a critical commerce venue even as TikTok Shop captures headline GMV growth. The platform’s strength lies not just in transactions but in the upper funnel: the brand discovery, aspiration-building, and social proof accumulation that precede purchases across all channels.
Facebook: The Incumbent Giant Holding Its Ground
Facebook is often omitted from social commerce narratives that favor younger, faster-growing platforms, but the data argues strongly for its continued relevance. 250 million people engage with Facebook Shops every single month, and an estimated 70 million Americans shopped on Facebook in 2025. The platform’s sheer scale — its user base remains the largest of any social network — provides a commerce surface area that no competitor can yet rival in absolute numbers.
Facebook’s advantages in social commerce stem from its demographic breadth (reaching consumers of all age groups), its Marketplace integration (which handles peer-to-peer and business commerce in a single environment), and its deep integration with Instagram through the Meta advertising ecosystem. For brands running paid social commerce strategies, Facebook and Instagram are rarely separated — they function as a unified commerce infrastructure that spans discovery, retargeting, and conversion across both platforms.
The combined Meta commerce ecosystem — Facebook Shops, Instagram Shopping, WhatsApp Business, and the connecting Meta advertising layer — represents the single largest integrated social commerce infrastructure in the Western world. While TikTok Shop may be growing faster on a percentage basis, the absolute scale of Meta’s commerce activity remains unmatched in the US and Europe.
Pinterest: The Forgotten Commerce Giant with the Highest Purchase Intent
Pinterest occupies a unique and frequently underappreciated position in the social commerce ecosystem. Unlike TikTok or Instagram, where social interaction and entertainment are primary and commerce is layered on top, Pinterest’s users arrive with explicit purchase intent. The data reflects this distinction sharply.
85% of weekly Pinners have made a purchase based on a brand’s Pin, a conversion signal that dramatically outperforms passive social browsing on other platforms. 93% of Pinterest users use the platform to plan purchases, actively researching products, saving ideas, building wish lists, and comparing options — behaviors that place them further along the purchase journey than the average social media user. The commercial payoff of this intent manifests in spending behavior: Pinterest shoppers spend 2x more per month than shoppers on comparable platforms, with a higher average order value that makes Pinterest particularly valuable for premium and aspirational product categories.
For brands in fashion, home décor, beauty, weddings, food, and lifestyle categories, Pinterest functions as a high-intent discovery engine with strong commercial follow-through. Its visual search capabilities, idea board architecture, and shopping catalog integrations create a commerce environment that is fundamentally different from the fast-scroll impulse dynamic of TikTok or the social-proof-driven commerce of Instagram. Pinterest is where considered purchases begin.
Livestream Commerce: The 30% Conversion Rate Phenomenon
Of all the statistics that define social commerce in 2026, none is more attention-grabbing — or more consequential — than the conversion rates achieved by live shopping. Standard ecommerce conversion rates hover between 2% and 3%. Livestream shopping events convert at up to 30% — a tenfold to fifteenfold improvement, confirmed by eMarketer, BigCommerce, GetStream, and Firework across multiple studies. That is not an incremental improvement. It is a category-defining structural advantage.
The mechanics behind this extraordinary conversion rate are well understood. Live shopping creates a real-time, interactive environment in which a host demonstrates products, answers viewer questions instantly, creates time-limited urgency through exclusive deals or limited quantities, and builds social trust through visible audience participation. The experience collapses the distance between discovery and purchase, creating conditions for impulsive but informed buying decisions. Viewers do not merely watch; they ask questions, react to responses, see other viewers purchasing, and feel the pull of a community moment. The result is a purchasing environment that is fundamentally more emotionally engaging than any static product page.
The scale of livestream commerce globally is enormous. Global livestream sales are projected to exceed $1 trillion by 2026, up from $682.5 billion in 2023, according to GetStream. China’s live commerce market alone has hit $800 billion, a figure that makes the US live commerce landscape look embryonic by comparison — though American growth is accelerating rapidly. The US livestream shopping market is forecast to reach $68 billion by 2026, representing approximately a 36% increase from 2025 levels. US livestream ecommerce sales grew nearly 50% in 2025 to $14.64 billion, with buyers jumping 21.5% year-over-year, according to eMarketer.
Video commerce more broadly captured 43.22% of the global social commerce market share in 2025, making it the dominant format across the entire social commerce ecosystem. Short-form video, shoppable livestreams, and product demonstrations now drive more social commerce revenue than static posts, carousels, or any other content format.
The adoption gap in the US remains a significant commercial opportunity. Only 12% of US shoppers have made a purchase through a livestream so far, with another 12% stating they plan to try it. That 76% of American consumers who have not yet engaged with live shopping represents the frontier of social commerce’s next growth wave. Live shopping could account for 10–20% of all ecommerce sales by 2026, per G2 — a projection that implies the US live shopping market has only scratched the surface of its potential.
Consumer Behavior: The Psychology of Social Buying
Understanding why social commerce works at the scale it does requires looking at consumer behavior data, which reveals a set of deeply ingrained habits and psychological drivers that make social platforms uniquely powerful selling environments.
82% of consumers use social media for product discovery and research before making purchase decisions. Social has replaced search as the dominant discovery channel, particularly for younger consumers. More than 60% of product discovery now happens on TikTok, Instagram, and YouTube, according to Sprout Social — a shift that has fundamentally restructured the marketing funnel. For many buyers, especially those under 35, the path to purchase no longer begins with a Google search. It begins with a scroll.
67% of US consumers make at least one purchase through social media each month, with 22% having bought more than 10 items in the past year via social platforms, according to Portada. These are not occasional dabbling behaviors. They represent an embedded commercial habit that has become a regular part of modern consumer life. The sheer frequency of social purchasing means that brands without a social commerce presence are effectively invisible to a growing segment of buyers at the moment of transaction.
The impulse dimension of social commerce is equally significant. 81% of consumers say social media compels them to make impulse purchases, with 28% reporting at least one impulse buy per month via social platforms. There are currently 114.3 million social media buyers in the US — 33% of the total population — actively transacting through social channels.
Among the younger demographic, social commerce adoption is near-total. 80% of Gen Z and millennials say social media drives their purchases, with 44% of Gen Z shoppers making a purchase on social media in the last month. Gen Z’s social media buyer rate stands at 56.0% versus 36.5% for the total population, per eMarketer. Millennials and adult Gen Z now command 32% of consumer spending — up 8 percentage points from 2020 — meaning their social-native purchasing behaviors are carrying enormous aggregate economic weight.
The influence economy is central to this dynamic. 65% of consumers have purchased a creator-founded product or service, a number that climbs to 91% among those aged 16–24. 58% of consumers over 18 have purchased a product because of an influencer endorsement, and 56% of Gen Z and millennials purchased based on a creator’s recommendation specifically, with health and beauty (53%) and apparel (41%) as the dominant categories. The creator economy and social commerce have become so deeply intertwined that the distinction between content consumption and commercial transaction has effectively dissolved for younger audiences.
Trust, UGC, and the Review Economy
The social commerce transaction does not succeed on platform architecture alone. It succeeds on trust — and the data around trust in social commerce is extraordinary in what it reveals about how modern consumers make decisions.
92% of people trust reviews and user-generated content more than advertisements. Traditional brand creative, no matter how polished, carries less persuasive weight than authentic consumer voices. 95% of consumers read customer reviews before making a purchase, and 86% consider those reviews essential to their buying decision. For brands operating in social commerce, this means that reviews and UGC are not optional marketing assets — they are the foundational infrastructure of conversion.
The commercial impact of UGC is quantified and compelling. Visitors who interact with user-generated content convert 102.4% higher than the average visitor. UGC-based ads generate 4x higher click-through rates than standard brand advertising. User-generated videos generate 6x higher engagement than branded video content. And for Gen Z specifically, the stakes are absolute: 64% of Gen Z shoppers have left an ecommerce store without purchasing specifically because it lacked customer photos or reviews. No social proof, no sale — a categorical rule for this generation.
This trust dynamic is one of the structural reasons TikTok Shop’s affiliate and creator program has been so successful. When a creator with an established audience recommends a product, they are transferring earned trust to the brand — a transaction that no amount of paid advertising can replicate. The 78% of TikTok users who report purchasing after seeing creator content are not responding to advertising. They are responding to a trusted peer recommendation delivered in a format they actively chose to consume.
Platform Conversion Rate Comparison: The Data Hierarchy
One of the most practically useful data points in the social commerce landscape is platform-specific conversion rates, because they directly determine the commercial efficiency of seller investment. The hierarchy in 2026 is clear:
TikTok Shop leads with an average in-app conversion rate of 3.4% (with in-app checkout reaching 5–8%), followed by Instagram at 2.7%, Pinterest at approximately 2.5% (adjusted for high-intent traffic), and YouTube at approximately 1.4%. These numbers represent the organic transactional efficiency of each platform’s commerce infrastructure. TikTok’s superiority here reflects both the platform’s algorithm-driven content discovery (which surfaces products to users already predisposed to relevant categories) and the frictionless in-app purchasing experience built into TikTok Shop.
Live shopping, as noted, operates in a different conversion universe entirely, with rates of 9–30% depending on the event, product category, host engagement, and urgency mechanics deployed. These live event conversion rates are consistently cited by eMarketer, BigCommerce, GetStream, and Firework — and they explain why live commerce investment is accelerating so rapidly across all major social platforms.
Social reselling — a segment that includes peer-to-peer resale of products within social environments — is the fastest-growing segment within social commerce from 2026 to 2031, expanding at a 34.26% CAGR according to Mordor Intelligence, reflecting the growing consumer comfort with transacting directly with other individuals through social channels.
The $1.2 Trillion Opportunity in Strategic Context: What Brands Must Do Now
The statistics assembled above converge on a single strategic imperative for brands operating in 2026: social commerce is no longer a test-and-learn channel. It is a core revenue infrastructure that demands serious organizational investment, creator partnership strategy, platform-specific content development, and operational readiness to fulfill and support the volume of orders it generates.
The $2.11 trillion global market — with the US alone crossing $100 billion — creates both enormous opportunity and meaningful competitive pressure. Brands that entered TikTok Shop early, built creator affiliate networks, and optimized their product listings for video commerce are now generating sales at the scale of mid-tier traditional retailers. Brands that waited are entering a more crowded, more expensive, and more competitive environment.
The live shopping frontier remains the most underpenetrated high-opportunity space in the US market. With only 12% of US shoppers having tried live commerce and conversion rates of up to 30%, the brands that build live shopping competencies now — host relationships, production quality, urgency mechanics, real-time customer engagement — will hold significant advantages as mainstream adoption accelerates toward the $68 billion US livestream market projection.
The demographic economics are also increasingly decisive. Millennials and Gen Z together command 32% of consumer spending and are growing their economic influence every year. Their default commerce behavior is social-native. Meeting them on the platforms where they live, with the content formats they trust, and the frictionless checkout experiences they expect, is not a growth strategy. In 2026, it is table stakes.
Key 2026 Social Commerce Statistics at a Glance
Global social commerce market size (2026): $2.11 trillion, growing at 29.12% CAGR
US social commerce sales (2026): $100.99 billion, crossing the $100B threshold for the first time
TikTok Shop global GMV (2025): $64.3 billion, 94% YoY growth
TikTok Shop projected global GMV (2026): $112+ billion
TikTok Shop US sales (2025): $15.82 billion, 108% YoY growth
TikTok Shop projected US sales (2026): $23.41 billion
TikTok Shop US social commerce market share: 18.2%, rising to 24.1% by 2027
US TikTok shoppers (2026): 80.4 million, ~67% of US TikTok audience
Instagram monthly shoppable post interactions: 130 million taps
Instagram US social commerce sales (2025): $42.8 billion
Instagram US shoppers: 46.8 million
Facebook Shops monthly active users: 250 million
Social commerce as share of global online sales: ~17%
Livestream shopping conversion rate: 9–30% vs. 2–3% for standard ecommerce
US livestream shopping market (2026): forecast at $68 billion
Video commerce market share within social commerce: 43.22%
Global livestream sales projected (2026): $1 trillion+
Consumers using social media for product discovery: 82%
US consumers buying via social media monthly: 67%
Consumers making impulse purchases via social: 81%
Gen Z social commerce buyer rate: 56% vs. 36.5% population average
Gen Z + millennial share of consumer spending: 32%
Consumers trusting UGC over ads: 92%
UGC interaction conversion lift: 102.4%
Global social commerce projection (2030): $8.5 trillion
Fastest-growing social commerce segment: Social reselling at 34.26% CAGR
Conclusion: The Feed Is the Storefront
The $1.2 trillion opportunity that captured the world’s attention in 2022 was never really about a single number. It was about a structural reorganization of commerce itself — a shift from destination shopping to ambient, always-on, content-embedded purchasing. In 2026, that reorganization is no longer a forecast. It is the documented reality of a $2.11 trillion market that spans platforms, geographies, demographics, and product categories with unprecedented velocity.
TikTok Shop’s rise from $0.3 billion to $23+ billion in US GMV in under three years is the headline statistic of this era. But the deeper story is systemic: 67% of American consumers now buy through social monthly; livestream commerce converts at 30% where traditional ecommerce converts at 2–3%; 82% of product discovery begins in a social feed; and an entire generation for whom this behavior is native is now commanding 32% of consumer spending and growing. The feed is the storefront. The creator is the salesperson. The live event is the retail theater. And the brands building for this reality in 2026 are not chasing a trend — they are building for the dominant commercial infrastructure of the decade ahead.
FAQs
The global social commerce market is projected to reach approximately $1.2 trillion by 2026, driven by explosive growth on platforms like TikTok Shop and Instagram. This rapid expansion reflects shifting consumer habits toward discovering and purchasing products directly within social media apps.
TikTok Shop has emerged as a fast-growing rival to Instagram, leveraging short-form video and live shopping to drive impulse purchases at scale. While Instagram benefits from a larger established user base and mature shopping infrastructure, TikTok Shop's engagement rates and conversion metrics have been outpacing competitors in key markets like the US and Southeast Asia.
Yes, social commerce can be highly profitable for small businesses, particularly those selling niche or visually appealing products, as platforms like TikTok Shop and Instagram lower the barrier to reaching targeted audiences without large advertising budgets. Success typically depends on consistent content creation, influencer partnerships, and optimizing product listings for in-app discovery algorithms.
Social commerce eliminates friction in the buyer journey by allowing users to discover, evaluate, and purchase products without ever leaving their favorite app. The combination of algorithm-driven personalization, user-generated reviews, and influencer trust signals creates a shopping experience that converts significantly better than traditional e-commerce channels.
Absolutely — analyzing social commerce data such as platform-specific conversion rates, average order values, and demographic engagement trends helps brands allocate budgets more effectively and identify where their target audience shops. Brands that align their content strategy with platform-native behaviors, like live shopping on TikTok or Stories-based drops on Instagram, tend to see the strongest return on investment.